EURUSD is showing a bearish divergence signal on the Daily Chart. In the last 2 months, EURUSD has climbed up around 1500 pips from a low of 1.04618. EURUSD rally seems to be exhausted now. Take a look at the following chart!
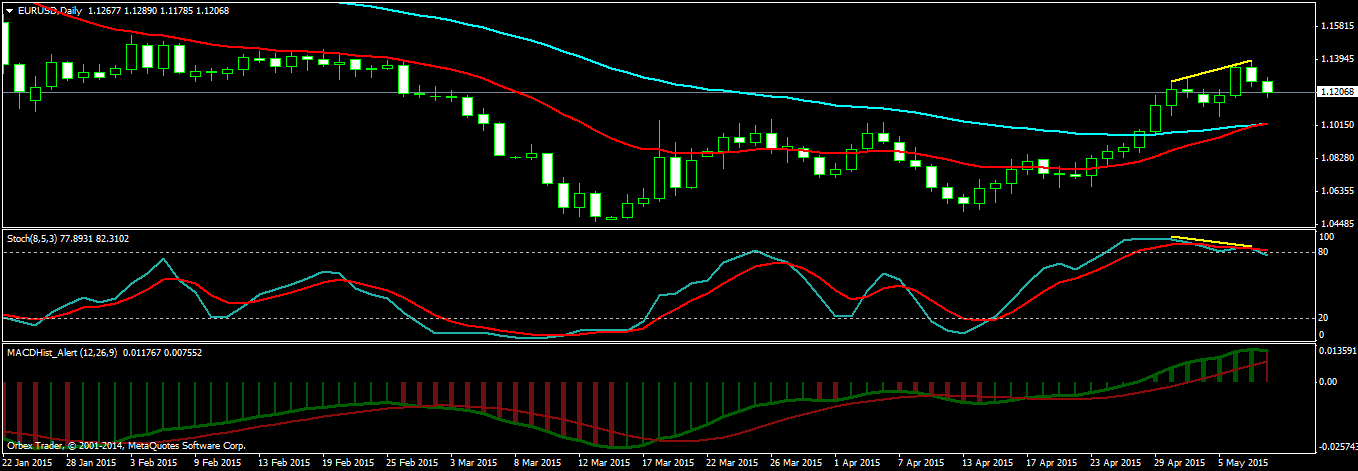
Do you see the yellow lines showing the bearish divergence on stochastic D1. This means EURUSD is going to fall and it can also mean this time EURO achieves parity with USD. Now look at this EURUSD Weekly Chart.
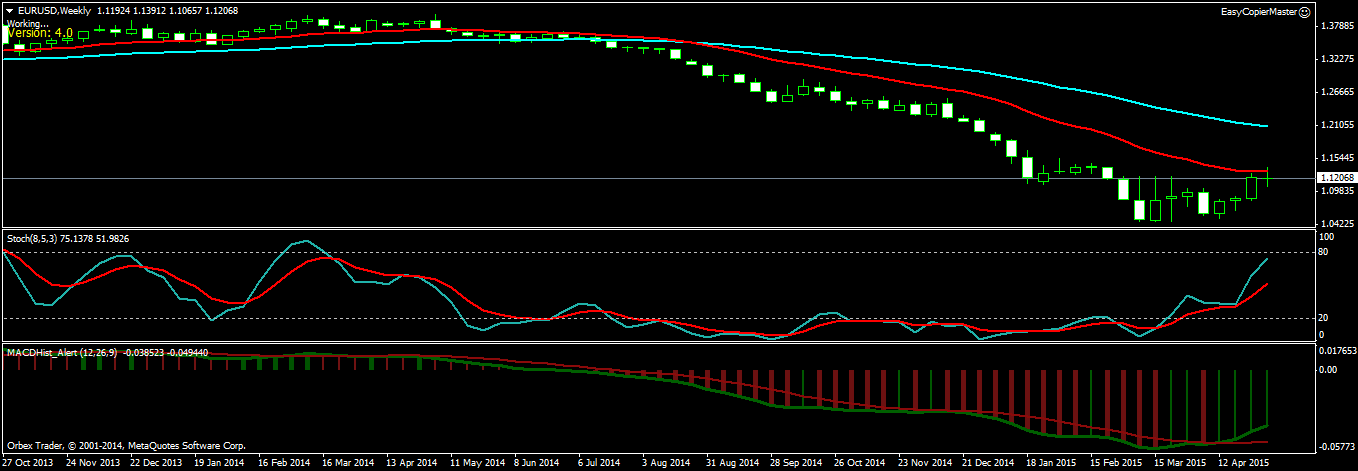
Can you see EURUSD finding resistance at EMA 21 which we call the fast line. There is a solid fundamental reason for the rally that started 2 months now and why it is ending now. You see some 2 months back USD suddenly started getting weak. This started the EURUSD and GBPUSD rally. Now USD is once again gaining strength. So this is why the rally lost steam and a downtrend is now clearly visible.
And if the FED decides to increase the interest rate in June after 2 months, it will make USD even more strong sending EURUSD into a strong tailspin. EURUSD is a good pair to trade as when it starts trending the trend can continue for weeks. So once you open a short trade with this bearish divergence pattern expect something like 500-1000 pips. Next week we are expecting a retracement. At the end of the retracement we are going to make an entry and with that that entry we expect to give us at least 500 pips.