In this post we are going to discuss in depth what is a Gartley Pattern. Gartley pattern is often used by the professional traders to find the turning points in the market aka the tops and bottoms. You must master trading this Gartley Pattern. In the last post I discussed what are harmonic price patterns and how you can trade them. There are some professional traders who simply love to trade these harmonic patterns. Gartley pattern is a harmonic pattern. In the last post I pointed out that these harmonic patterns are identified using fibonacci retracement levels. What makes this pattern powerful is the great reward/risk that this pattern provides. When you combine them with Elliott Waves you can find the big moves in the market. Take a look at the screenshot below.
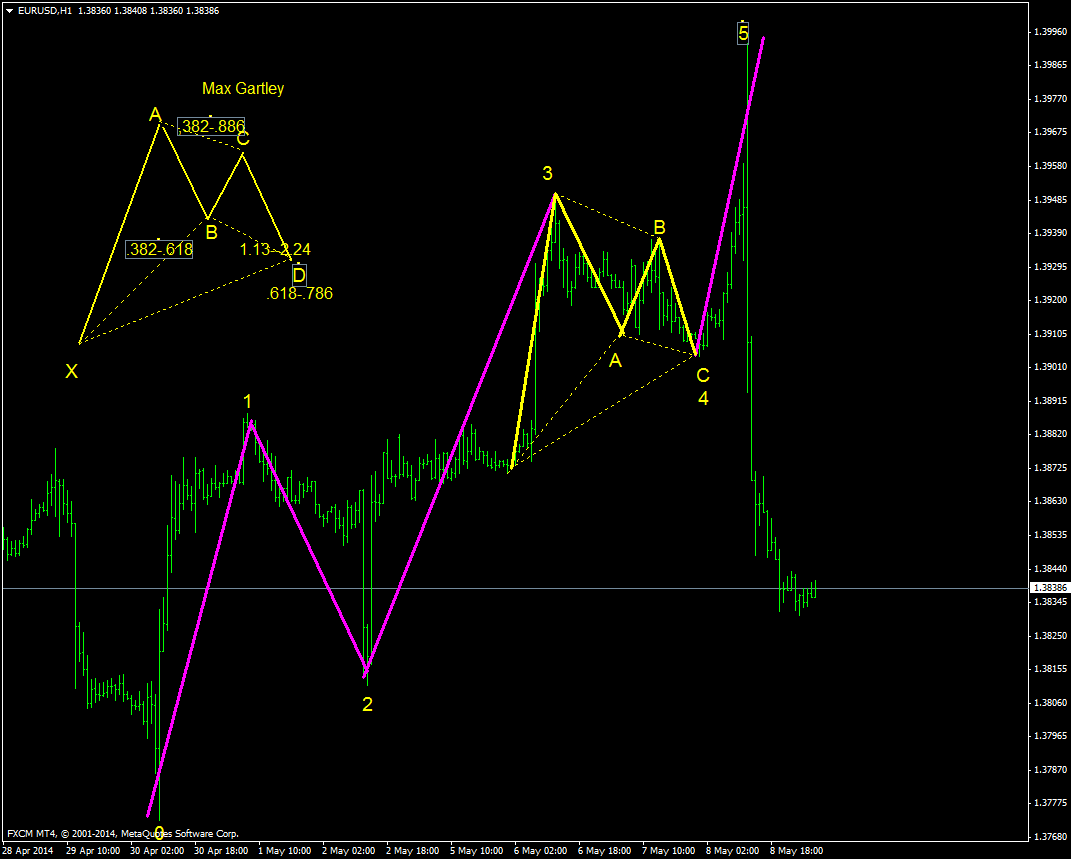
As you can see this is a screenshot of EURUSD H1 timeframe. First the Elliott Wave has been identified with 0-1-2-3-4-5 swing levels. 01 is the first impulse wave. 12 is the corrective wave which is followed by a big impulse wave 23. 34 is a corrective wave and in that you find the Bullish Gartley Pattern marked. Bullish Gartley Pattern signals a big bullish move which you can see marked as 45. 45 is the last impulse Elliott Wave. After that the market turns and changes direction making a new Elliott Wave in the down direction.
Gartley Pattern Rules
In the above screenshot XABCD has been drawn correctly but marked wrongly within the Elliott Wave . For the correct marking of this pattern you should check the top of the screenshot. On the top left of the above screenshot you can see the Gartley pattern XABCD marked in detail. As I said in the beginning this pattern has to obey certain fibonacci retracement rules before it can be qualified as a proper and valid Gartley Pattern. Point B should be 0.618 fibonacci retracement level of XA swing. Point D should be 0.786 of the XA swing. Point D should also be either 1.27 or 1.68 extension of the AB move. Point C should retrace between 0.382 to 0.886 of the AB move. This sounds a bit complicated? Watch the video below that explains the rules in detail.
In the above video you get a clear understanding how to identify this pattern on a live chart. Learning this is something very important for you learn and master. This video by Josh Martinez also explains how to identify and trade this pattern correctly.
https://www.youtube.com/watch?v=rajGVJVEwTY
After watching these 2 videos you should have a good idea on the rules on how to identify and trade this pattern. If you don’t understand his pattern, watch the above 2 videos again a few times so that you grasp how to identify and trade this pattern.
This Pattern Is Also Known as Gartley 222
This pattern was first used by a stock trader Harold McKinley Gartley in 1930s. Mr. Harold McKinley Gartley used to run a successful stock advisory service in 1930s that had many clients. Mr. Harold Gartley was amongst the first professional stock traders who applied scientific and statistical methods to identify the market psychology.
The pattern is also known as the “Gartley 222” because the pattern originated from page 222 of H.M. Gartley’s book, Profits in the Stock Market that was published in 1935 and reportedly sold for $1,500 at the time. Chart patterns are ideal when it comes to showing the market psychology. These chart patterns work in all sorts of markets. So learning these chart patterns can help you trade currencies, stocks, commodities etc. You should watch this video below by James Stapleson also in which he tried to explain this pattern.
Now you must have heard the word market structure a lot in the above video. Understanding the market structure is very important before you enter into a trade. As said above the most important thing is how to identify this pattern correctly on the chart. Watch this video also that explains how to identify this pattern.
You must have observed something. This pattern looks almost like the M and W pattern. Yes it does. Now there are certain variations of this pattern that have been named on animals. These variations are:
- The Crab Pattern
- The Bat Pattern
- The Butterfly Pattern
The Crab Pattern
The Crab pattern was discovered not very long ago. A firm believer in this pattern Scott Carney discovered this pattern in 2000 some 16 years back. The original pattern was discovered more than 85 years back in 1930s as said above while the Crab Pattern was discovered in 2001. In the Crab Pattern point D forms well beyond point X. Watch the video below which explains this pattern in detail.
The Bat Pattern
The Bat pattern was also discovered by Scott Carney in 2001.
The Butterfly Pattern
The Butterfly pattern was discovered by Bryce Gilmore. The Butterfly pattern should have 0.786 retracement of the AB move in respect of the move XA. Sounds confusing? You should watch this video that explains this pattern in detail.