Charts are nothing more than collective records of buying and selling over a period of time. It has been observed that some chart patterns form on these price charts repeatedly over all timeframes and almost all markets. Many academics argue that financial markets are inherently random in nature. It has been observed that within this randomness there is some repetition. Harmonic trading is based on historically proven and tested chart patterns having certain specific Fibonacci ratios that repeat regularly on all timeframes and all markets. Once we identify a harmonic chart pattern, we must check the validity of the harmonic chart pattern and make a decision whether to execute the trade or not. When we decide to execute the trade, we then need to manage it. As said above a harmonic chart pattern have certain consecutive Fibonacci ratios that we must check first. Did you read the post on Bayesian Autoregression trading strategy?
In order to understand harmonic chart patterns, you should be familiar with the Fibonacci number sequence. We obtain the next number in the Fibonacci number sequence by adding the previous two numbers: 0,1,1,2,3,5,8,13,21,34,55,89,144,233,377…..Now 89/55=1.618. 1.618 is known as the Golden Ratio. 1.618 and its inverse 0.618 are important Fibonacci numbers. Why do we have Fibonacci ratios in chart patterns? It is a deep philosophical questions. As traders we should just focus on chart patterns that work repeatedly in the market. That’s all. As said above 1.618 and 0.618 are primary Fibonacci number that appear regularly in these harmonic chart patterns. These two numbers are also used a lot in the Elliott Wave Theory. When we look for harmonic chart patterns, the different legs in the pattern are supposed to confirm to these Fibonacci ratios. A recent discovery is the 0.886 ratio. 0.886 retracement is crucial in differentiating between a number of harmonic chart patterns. Keep this in mind 0.886 is the fourth root of 0.618. Read the post on how to use fuzzy logic in trading.
Harmonic patterns have specific price structures based on certain Fibonacci ratios. Each harmonic pattern must possess an exact ratio that must not be violated for the chart pattern to be valid. The most significant point in any harmonic pattern is B the middle point. Harmonic patterns are based on incredible precision unlike other chart patterns. There are no variations permitted in the Fibonacci ratio alignments unlike other patterns that can be fuzzy. In essence there are precise rules that validate each harmonic pattern before think of trading it. Harmonic patterns can indicator the potential turning points an area known as Potential Reversal Zones(PRZ). PRZs are areas where buying and selling is highly imbalanced. The best trading strategy catches the big moves with a small stop loss. Read this post on a USDJPY trade that made 400 pips with 20 pip stop loss. Modern electronic markets are highly unpredictable. Read this post on how GBPUSD fell more than 600 pips in less than a minute all of a sudden as a result of a rogue robot. There is always a risk of a flash crashing occurring. The chance of a flash crash are increased when the market has low volume.
I was coding Harmonic Chart Patterns in my indicator. I thought I should write a post on harmonic chart patterns as well and how to code them. The crux of any trading strategy is being able to predict when the price is about to make a big move. If you can catch a big move in its infancy successfully, you are on your way to your trading success. Chart patterns are one of the time tested methods to predict when the price is about to make a big move. Forget machine learning and for that matter deep learning, chart patterns still work, have worked in the past and will also work in the future. Why? Chart patterns are just a result of crowd psychology. Markets are in essence just crowds of buyers and sellers. Crowd psychology rules the market and the chart patterns appears as a result of this. So chart patterns will always work. Chart patterns are an important part of naked trading. Watch this video on how to identify and trade a cypher pattern.
I am coding a trading strategy based on Harmonic Chart patterns for NinjaTrader in C#. I thought I might as well write a blog post on harmonic patterns also and refresh my knowledge of harmonic patterns like AB=CD, Gartley, Butterfly, Crab etc. Gartley is a very important chart pattern and it has an average success rate of 70% which is quite awesome. Gartley chart pattern is something that I want to focus on. Why? We can use Gartley chart pattern to identity head and shoulder pattern as well as the double top and the double bottom pattern. Double top and the double bottom patterns are special cases of Gartley chart pattern. I will explain how in detail in this post. Chart patterns can fail. Always keep this in mind. There is no surefire method of trading. We are always dealing with probabilities. Chart patterns are an important tool in technical analysis as they have good predictive power most of the time. Why chart patterns work? Chart patterns work because they form as a result of the human emotions like fear and greed in the market. Sometimes the market is taken over by greed and pretty soon you can see the market taken over by fear which causes these chart patterns to form in price action. Bulls and bears are the controlled by greed and fear. So when the bulls take over the market the market participants are greedy and irrational. When the bears take over the market participants are fearful. If market participants had been rational there would have been no chart patterns.
Charts patterns have been there for centuries. In the 16th century, Japanese rice traders developed candlestick charts and identified certain patterns that would appear before the market changed direction. IN those days there was no internet and no emails. So you can think that markets would behave differently as compared to today when we have instant communication tools. Doji, Harami etc had meaning. Fast forward. Today the markets are electronic. Information travels at the speed of light and markets react very fast to shocking news sometimes as fast has second and milliseconds. But you will be surprised to know that candlestick patterns still work. Why? Candlestick patterns just depict the market sentiment in a certain period of time. We can use candlestick patterns on any timeframe. In the same manner we can use AB=CD, Gartley patterns on any timeframe and comebine them with candlestick patterns to make them more powerful.
Academia has always been skeptical about technical analysis and chart patterns. Eugene Fama got the Nobel Prize for theorizing that markets are efficient and price is a random walk. For a few decades people thought he was right. If Eugene Fama and his Efficient Market Theory (EMH) is correct than it is impossible to make money as a trader. Why? Market is a random walk and we cannot predict the random walk so in the long run, trader will lose more and make less. But there are traders who have made millions in the markets. How? Technical analysis and chart patterns works despite academics saying technical analysis doesn’t work.
In 2000, a paper was published by Dr. Andrew Lo from MIT in the BusinessWeek, ” This Alchemy Will Yield Pure Gold.” In this paper Dr. Andrew Lo showed using mathematical statistics that technical analysis indeed does provide an edge. Subsequently he alongwith with his another colleague published the book,” A Non-Random Walk Down WallStreet.” In this book, he showed that chart patterns do have predictive power and this can be prove statistically. After that everyone in the finance world started taking chart patterns seriously. As I have said Japanese rice traders were using chart patterns some centuries ago. Great names like Jesse Livermore used chart patterns. AB=CD and Gartley pattern were discovered around a century ago. We will start by discussing these two important chart patterns. Let’s start.
AB=CD Chart Pattern
AB=CD chart pattern is simple chart pattern that repeats in all different markets on all different timeframes regularly. You can say AB=CD is one of the most basic and simple chart patterns. AB=CD chart pattern was first described in detail in 1935 by H.M Gartley, “Profits in the Stock Market.” Keep this in mind, 1935 is the time of Great Depression. Mr. Gartley sold his book at an incredible price of $1.5K which was equivalent to buying three Fords those days. AB=CD pattern is the foundation on which the Gartley chart pattern is based. AB=CD is a measured move pattern. Important thing is AB and CD legs should be almost similar. IN the GBPUSD 15 minute chart below you can find the AB=CD pattern marked:
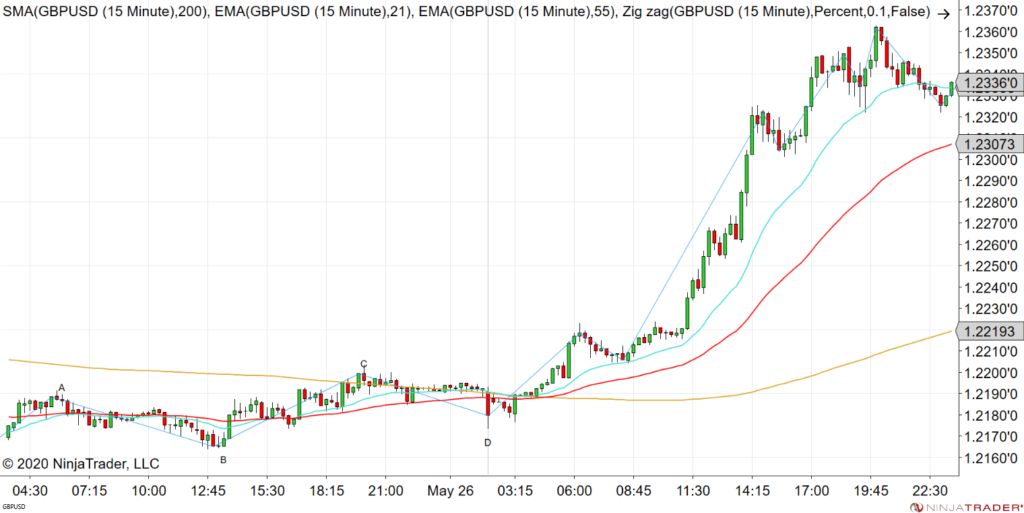
As you can see in the above chart, AB and CD legs are almost equal in pips and bars. AB and CD seldom match exactly but most of the time we will find them pretty close. After the D point, you can see price making a big move of around 15 pips. If you have used moving averages and MACD, you will be looking for a sell trade. AB=CD pattern alerts you to a buy trade. You can trade it straight away or wait for confirmation. As you can see from the above chart, AB=CD pattern is not difficult to implement in your trading system. We will discuss more how to do it later. It is always a good idea to have a multi timeframe trading strategy. Let’s see what we have on the GBPUSD M20 chart below:
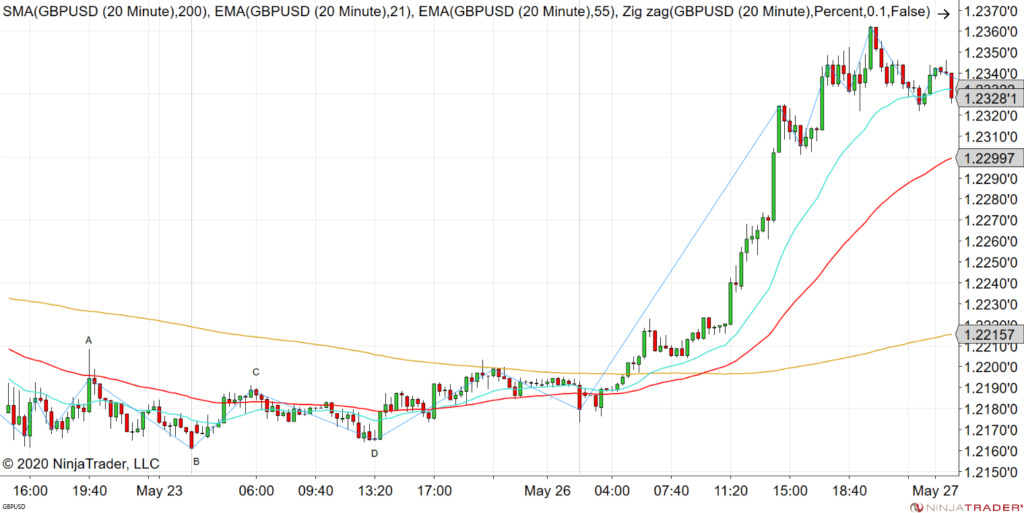
As you can see we also have an AB=CD pattern on GBPUSD M20 chart. One we have the chart pattern, we can decide to make an entry. Price is below SMA200 and EMA55 when the AB=CD pattern forms giving us a signal that GBPUSD is bullish and avoid any short trade. As you can see above AB=CD is a four point price structure. AB=CD is the basic foundation of all harmonic patterns. C point is the defining level in this pattern. BC projection is critical. The important point to keep in mind is that the BC projection should converge very closely for AB=CD pattern to complete. The C point can be anyone of the these Fibonacci ratios: 0.382,0.5,0.618,0.707,0.786 and 0.886. Point D should be a BC projection of 1.13.1.27,1.41,1.618,2.0,2.24,2.618 and 3.14. There two AB=CD patterns: Bullish AB=CD pattern and Bearish AB=CD pattern. Above I gave you the example of a bullish AB=CD pattern. Now let’s see if we can identify a bearish AB=CD pattern.
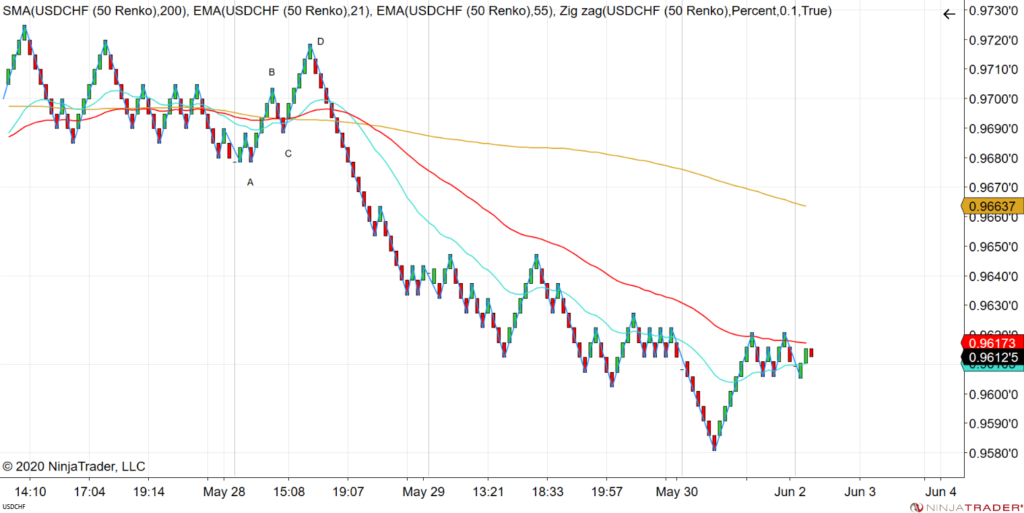
Above you can see a USDCHF Renko Chart with AB=CD chart pattern marked. This AB=CD pattern gave an early signal for a USDCHF down move that was around 120 pips. Not bad, huh! Keep this in mind. These are cherry picked chart patterns that show AB=CD with good signals. AB=CD can fail. When we are trading we are trading with probabilities. There is always a chance that the chart pattern can fail. How do we cater for this? We cater for this when we discuss risk management and the placement of stop loss below in the article. For now just remember chart patterns can fail and we should cater for this in our risk management system. Now AB=CD meaning AB should equal CD for the pattern to be valid. But we also have valid patterns if 1.27AB=CD and 1.618AB=CD. These are known as Harmonic AB=CD patterns. The perfect AB=CD pattern is defined by the point C that should be 0.618 retracement of leg AB. Then we should have 1.618 BC projection and finally almost equal time duration for each leg.
Potential Reversal Zones (PRZ)
In harmonic chart patterns we have the concept of Potential Reversal Zones (PRZ). PRZs are specific price structures where we have three or more Fibonacci numbers converging in a zone. By calculating the Fibonacci ratios in a price structure we can identify a potential reversal zone where price has a high probability of turning or reversing itself. PRZs are windows of opportunity where the price has the potential of reversing. Chart patterns are a belief that market provides the signals before it makes a turn. PRZs a truly remarkable technical analysis tool that provides the trader with a leading indicator. Once we have the AB=CD pattern completing we have a PRZ. In this PRZ we then look for a low risk trade entry. In short, when we have a chart pattern validated using Fibonacci ratio alignments, we have the PRZ where the price can make a reversal. Now it is upto us to find a low risk entry in this PRZ.
In AB=CD pattern, C point is the defining level. After that BC projection is very critical in the structure of the chart pattern. The C point retracement of AB leg indicates which BC projection is used to define the PRZ. For example a 0.382 C point retracement should have 0.24 or 2.618 BC projection. 0.5 C point retracement should have 2.0 BC projection while 0.618 C point retracement should have 1.618 BC projection. The C point retracement can be 0.382, 0.5, 0.618, 0.707,0.786 or 0.886. This correlates into a BC projection that can be 1.13, 1.27, 1.41, 1.618, 2.0. 2.24 or 2.618. Do we need to have AB=CD in the pattern? Before I forget to mention, this pattern is also known as the Lightening Bolt pattern.
AB and CD legs should be similar. This is the answer to the above question. It is obvious we cannot have AB=CD exactly but we can have both lengths almost similar. But at times the CD leg can extend. Around 40% of the time we will have AB=CD. But around 60% of the time CD leg will have a different length as compared to AB leg. CD leg can be an extension of AB leg from 1.27 to 2.0%. CD slope or angle is steeper than AB.
A perfect AB=CD has a precise 0.618 point C retracement of AB leg and then a 1.618 BC projection for the CD leg. The number of bars in the two AB and CD legs should be almost same. Now most of the time we cannot have AB=CD. This happens only 40% of the time as said above. We can also have 1.27AB=CD and 1.618AB=CD. These are the minimum requirements for the AB=CD pattern to be valid. In short, we should have a minimum AB=CD. C point retracement can vary between 0.382 to 0.886. But 1.618 is the preferred retracement of C point. BC projection can be between 1.13 to 3.618 and we can also have alternate AB=CD patterns.
As you can see AB=CD pattern possesses a variety of Fibonacci ratios. At the completion of AB=CD pattern we have identified support and resistance levels. AB=CD pattern should have a minimum AB=CD. C point can be a retracement of leg AB that can vary between 0.382 and 0.886. However 0.618 is the preferred retracement level. BC leg projection can vary from 1.13 to 3.618. Just keep this in mind that AB=CD is the foundation of all harmonic chart patterns. Now let’s move on to the famous Gartley Chart Pattern. Watch this video on one candlestick pattern that changed everything for me. Combining candlestick patterns with harmonic patterns is a good idea. It can give us a better entry with a low risk.
The Gartley Chart Pattern
The Gartley chart pattern is one of the most important harmonic chart pattern. It has an almost 70% win rate. So you can see we have a good chart pattern at our disposal that have very precise rules for its identification. We can build our trading system based on the Gartley Chart pattern. AB=CD pattern forms within the Gartley Chart Pattern. This is very important for you. Just keep this in your mind. Gartley chart pattern was first publicly mentioned by H.M Gartley in his book,”Profits in the Stock Market”, in 1933. As said above he sold his book for $1500 and all 1000 copies got sold immediately. In his book, Gartley did not use any Fibonacci ratios. Fibonacci ratios got introduced later on by other traders. Scott Carney introduced the use of Fibonacci ratios in identifying the Gartley pattern. Modern Gartley Pattern is different from what was explained in the above book. I have a previous post on how to trade a Gartley pattern. Watch the videos post there.
As said in the beginning, this post is more focused on the finer details on how to identify harmonic patterns like Gartley and then code them in a trading system. XABCD is a Gartley pattern if it has B point at exact 0.618 retracement of AB leg. Then we should have a valid AB=CD pattern to the overall pattern to be classified as a Gartley pattern. The AB=CD pattern should converge in the same areas as 0.786 XA retracement. The completion of AB=CD pattern and 0.786 retracement are actually minimum requirements for the Gartley pattern to be valid. Gartley pattern has got its own PRZ. Many times you find the AB=CD pattern and the 0.786 XA retracement overlapping in the PRZ. The BC projection in the Gartley pattern should not exceed 1.618. If BC exceeds 1.618 then we no longer have a Gartley pattern rather we have a new harmonic pattern known as the Bat pattern. C point in the Gartley pattern should be within the range 0.382-0.886 retracement of AB leg. The specification of Fibonacci ratios between the points are extremely critical in determining a valid Gartley Pattern. The BC projection should be 1.13,1.27, 1.41 or 1.618. Just keep this in mind if BC projection exceeds 1.618, it no longer a Gartley pattern. Gartley pattern works on all timeframes and all markets that includes cryptos as well as gold (XAU/USD).
Why confluence of different indicators increases the chances of a good trade? Let’s discuss this because all we are doing here is building patterns that have rather precise rules. We need to know how this helps in making high probability trades. Suppose we have three indicators. All three indicators are independent and each has a probability of giving a winning trade of 30%. 30% win rate means in 10 trades we will only make 3 good trades and 7 trades will be losers. Suppose we combine the three indicators. What this means is that we only trade when we have the three indicators give us the signal for trade at the same time. What is the probability of success this time? Since each indicator has 30% winrate. The lose rate is 70%. All three indicators are independent means they give signals independent of each other. Combining the three means the probability of losing will be 0.7X0.7X0.7=0.343. So have now a probability of losing of only 34% instead of 70%. Wow! Combining the three indicators has increased the probability of success to 66%. Previously it was only 30%. If we had four instead of three independent indicators, combining them would have increased the probability of success to 76%. Individually each indicator had only 30% probability of success. This is the basis of Ensemble Learning in machine learning. In Ensemble Learning, we combine weak learners that are independent and increase the odds of success drastically. This was the case of three failures occurring at the same time. You can see the probability of that happening is small.
Fibonacci Price and Time Clusters
Harmonic Chart patterns simply means chart patterns that have Fibonacci ratios in them. These Fibonacci ratios can be exhibited as Fibonacci Retracement, Extension or a Projection. We need to dive deep into the world of Fibonacci Trading and see how we can apply these Fibonacci ratios to both the price as well as time axis. We just want to add another filter to our trading system so that we have more confluence. Reading the above paragraph must have convinced you how confluence can increase our odds of winning drastically. The only caveat is we need to use independent methods to find confluence. I just showed you above how using three poor strategies with just 30% winrate, when we combined them we have a whopping winrate of 66%.
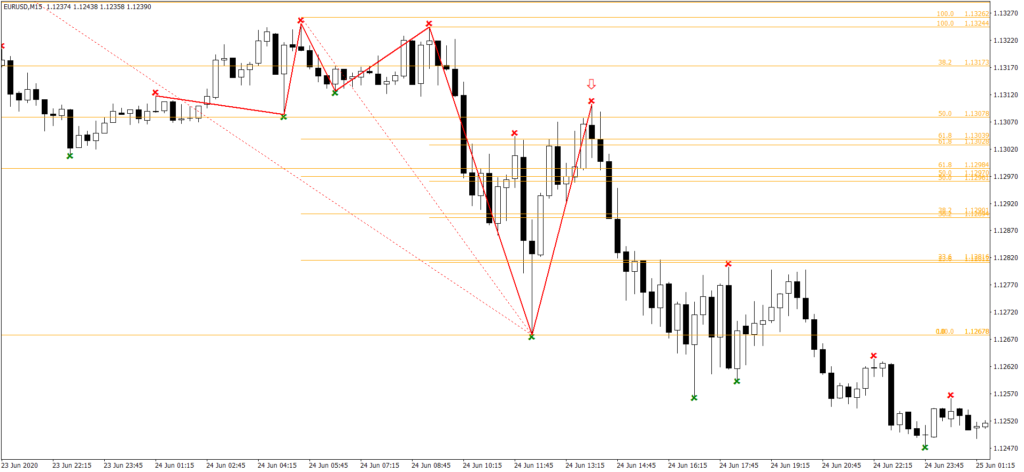
Why I am delving into Fibonacci patterns now you might ask? Harmonic chart patterns are all based on Fibonacci ratios. In order to understand the AB=CD pattern and the Gartley pattern we need to delve into Fibonacci price relationships like the retracement, extension and projections. Fibonacci Retracement is run from prior swing low to swing high or from prior swing high to swing low. We use the following Fibonacci ratios when we run the retracement: 0.382, 0.5, 0.618 and 0.786. If the swing is long, we can also use 0.236 ratio. Multiply the length of the swing with the Fibonacci retracement ratio and subtract it from swing high if it is a swing from low to high. If it is a swing from high to low, in this case add it to the swing low. Take a look at the following chart:
Fibonacci Price Retracement Clusters
In the above EURUSD M15 chart, you can see I have applied the Fibonacci retracement tool on MT4 to the price swings marked with red and green arrows. Red is for the swing high and green is for the swing low. Take a look at the candlestick below the big red arrow. Here we find the retracement level of 0.618. I am just focusing on pure price action as I am a naked trader. If we make a entry on the second candle after the candle with the red arrow, we will be catching a 100 pips move with a small stop loss of 10 pips. We will be using a pending limit order for making the entry. We will be using more than one swing in drawing these levels. I will explain how in the post below. So keep on reading. The idea is to find a Fibonacci price cluster so that we have confluence. We will also use Fibonacci ratios on the time axis and combine them with the price clusters to filter our the best trades. Take a look now at this GBPUSD chart.
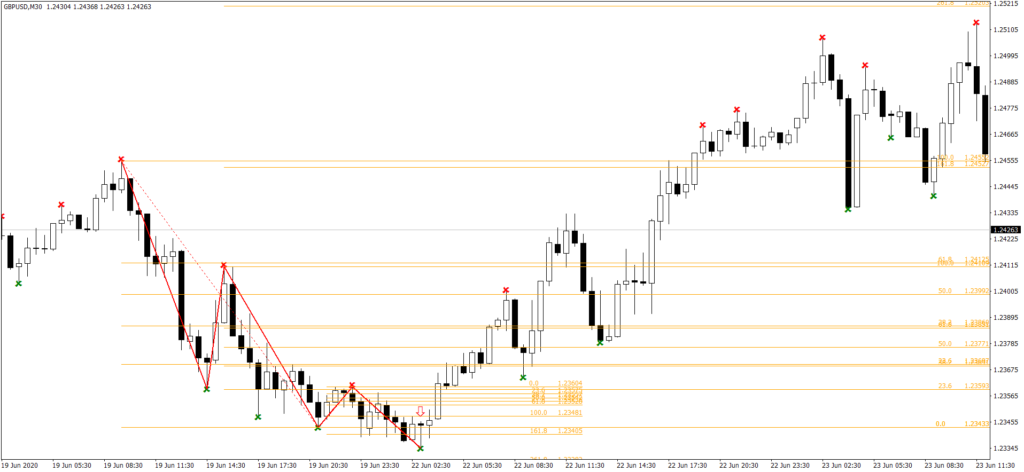
In the above GBPUSD M30 chart, we once again applied the Fibonacci tools to the price swings and found that there are certain swings where we are getting confluence of three or more levels. What I have done is run retracements on the multiple swings on the charts to get a Fibonacci Price Cluster. First we identity the highest high in case of a retracement from low to high swing. Then we need to connect the different lows in the swings to the highest highs to run the retracements. The same goes for the the swing from high to low. IN this case we first identify the lowest low and then connect it with multiple highs with the Fib retracement tool. So what we do we run multiple retracements. Take a look at the following chart.
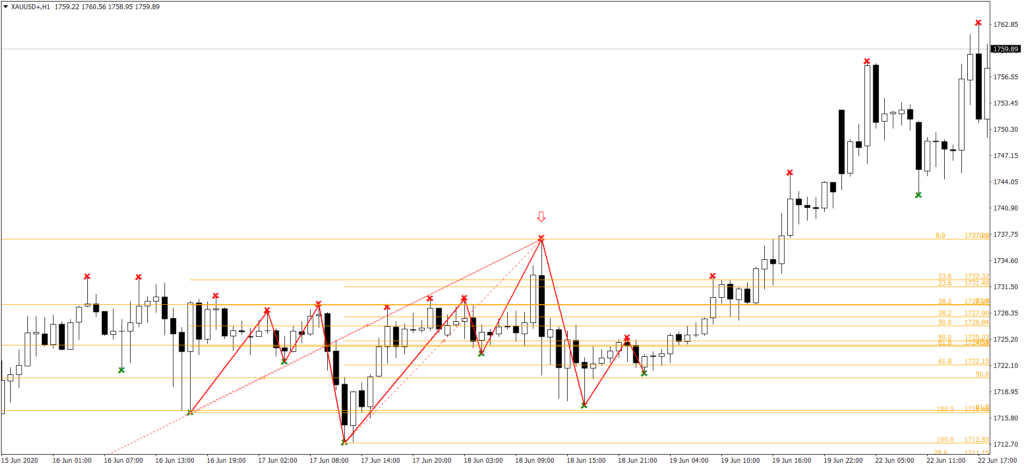
Above is the XAUSD H1 chart. IF you trade gold, you can see how gold loves Fibonacci levels. First I identified the highest high and then ran multiple retracements from three different lows. Avoid using a high or low that has been exceeded.
Fibonacci Price Extension Clusters
Now let’s discuss Fibonacci Price Extensions. Fibonacci Price Extensions are just like the price retracement. The only difference between retracement and the extension is that retracement is only upto 100% while extension is extend beyond 100%. When it comes to price extensions we use the these Fibonacci rations 1.27%, 1.618%, 2.618% and sometimes 4.236%. We were talking about Fibonacci Price Clusters which can comprise retracements, extensions and projections. Take a look at GBPAUD M30 chart below:
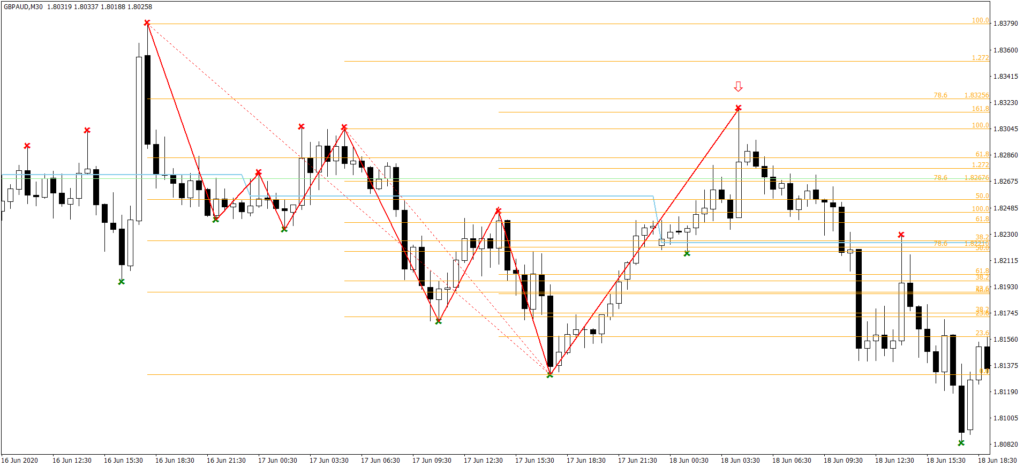
We have used three swings here. The lowest low was connected with three highs as you can see in the above chart. Take a look at the candlestick below the red arrow. Here we have two extensions 1.618% and 100% and a retracement of 68.1% all appearing in the body of that candlestick. Now there will be times when market will pause at these Fibonacci levels and then completely ignore them. So keep this in mind, we are dealing with probabilities. The more Fibonacci levels we have coming together at a particular candlestick, the higher the chance things will work out. Fibonacci levels work on all timeframes. The challenge is how to code the above relationships. Harmonic patterns are all based on strict Fibonacci rations. When we look for Harmonic Chart Patterns, we are looking at Fibonacci retracements, extensions and projections.
Harmonic Chart Patterns Cons
Identification of AB=CD chart pattern and the Gartley chart pattern is a subjective thing. When I started coding these two chart patterns, I realized it all depends on how you identify the swing which in return identify these chart patterns. Subjectivity is the enemy of artificial intelligence. One method to overcome subjectivity is to define probabilities. Trading is indeed a game of probabilities. What happens with harmonic patterns is that most of the time will be missing important trading signals. Chart pattern analysis is not an exact science.Once I failed miserably with Harmonic patterns, I opened a few good books on Fibonacci trading and learned a few more tricks that can make the chart pattern analysis much easier while at the same time we have ample of good trading signals that we can trade.
Harmonic Chart Patterns completely disregard the time axis and don’t use the Fibonacci time analysis at all. As a matter of fact there is a full fledged Fibonacci Price Analysis and a full fledged Fibonacci Time Analysis. Just like the price axis which obeys Fibonacci ratios, it has been observed that time axis also obeys Fibonacci ratios. Instead of time, we use count of time bars. The count of time bars between two highs, two lows, high-low, low-high or multiple highs and lows seems to obey Fibonacci ratios just like the price. We can make use of this information to further fine tune our trading signals and filter out false signals from the good ones. In the end what we need is a 5 star trade. Take a look at the following EURUSD M30 chart.
Symmetry Chart Pattern
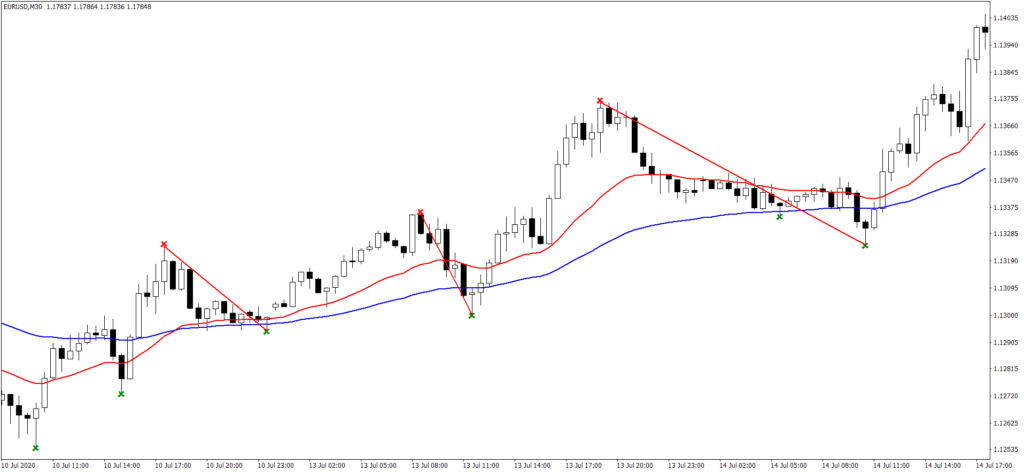
As you can see in the above EURUSD M30 chart, I have connected a few High Low Swings with red lines. The second red line is 1.27 times first high low swing and the third red line is 1.618 times the first high low swing. The number of bars in the first high low swing is 0.618 times that in the second high low swing and the number of bars in the third high low swing are 2.618 times the first high low swing. You can see both the Fibonacci price and time analysis complement each other. In Harmonic Chart Pattern analysis we don’t study the number of bars in each swing. Above EURUSD M30 chart is a good example of the Fibonacci Symmetry Pattern. After the third swing in the above chart, EURUSD made a strong rally and climbed above more than 150 pips.
Instead if we had tried to identify AB=CD pattern or the Gartley chart pattern, we would have failed miserably. Using the first high low swing we could have made long entry either at the low of the second high low swing or the low of the third high low swing. Symmetry chart patterns works very well when you are trading in the direction of the trend. Gold has made a remarkable rally from $1500 to $2000 per ounce. Let’s check if we can predict the turning point using harmonic analysis. The idea is to use Fibonacci retracement, Fibonacci Extension and Fibonacci Projections to see if we have a price where we have more than three of these levels meeting. When this happens it is known as Confluence.
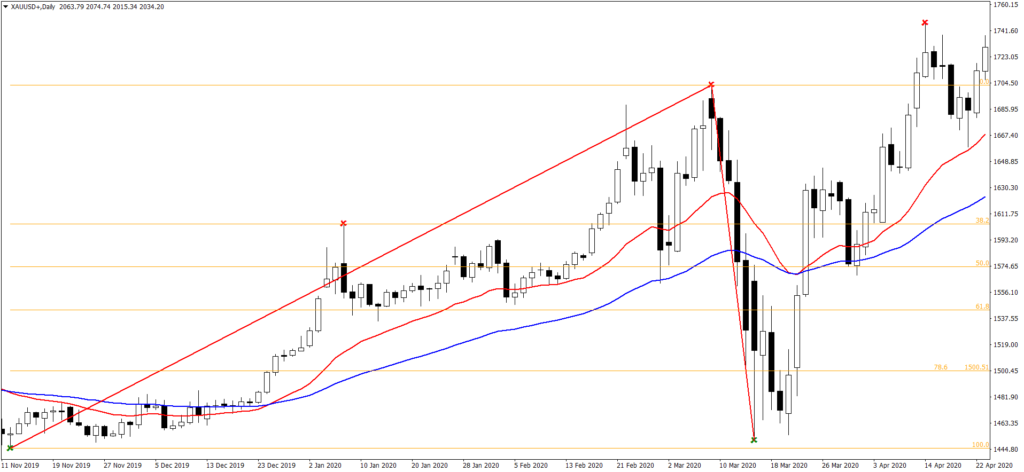
Above is XAU/USD daily chart. I have used a modified fractal indicator that marks the peaks and troughs. As you can see above the we have a 78.6% level where gold price is finding support. This price is $1500. Actual gold price went down to $1451 and found strong support at that level as you can see from the above chart of gold daily price. This happened around March 16th onwards. After that we have a strong rally in the gold price that has touched $2K now. It seems gold prices will make a retracement and then again rally up. Gold price can retrace back to around $1930 before making a push up. Now take a look at this gold daily chart same price bars but with a different swing level.
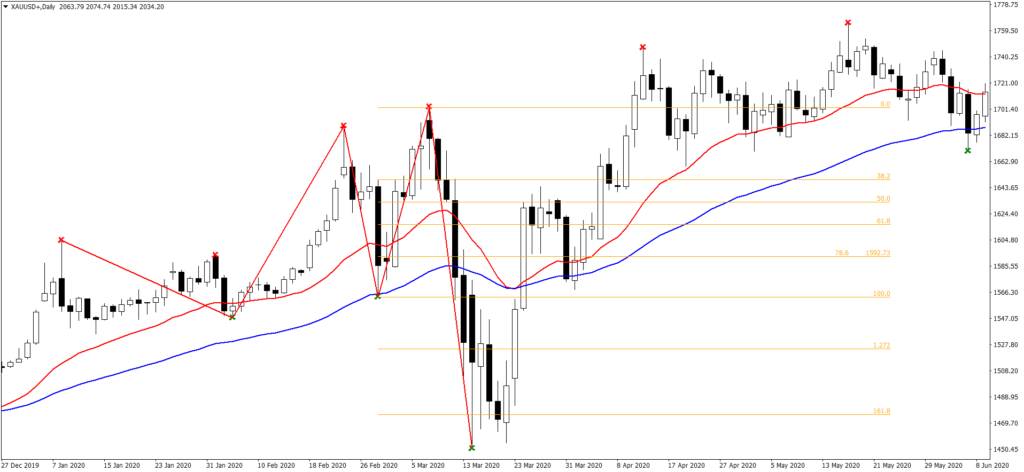
Here I have used a different swing level. It is the same chart as above. First we see we have nice 1.68% Fibonacci extension where gold prices are finding support. Then we if project the alternate price projection, we have again a nice projection with Fibonacci ratio of 2%. If we count the number of bars in the alternate price sections we have 5 and 6 bars which is almost close. When the bars are +1/-1 we can say that are equal in Fibonacci time analysis. It may sound confusing to you now but when you practice identifying these patterns, you will soon realize how everything makes sense. When we project price we can use Fibonacci ratios of 0.382, 0.618, 1, 1.27. 1.618, 2 and 2.618. Suppose we missed this point we can find another entry point. We should also use H12, H8, H6 and H4 charts in order to get more signals. As you can see we have a much more flexible system as compared to the straitjacket of Harmonic Patterns.
As I have pointed out above, Harmonic Patterns like AB=CD and Gartley are too strict for a chart pattern. Most of the time, you will find that you missed the pattern with a small deviation meaning it was very close but the algorithm couldn’t identify it. Take a look at the following USDJPY M30 chart.
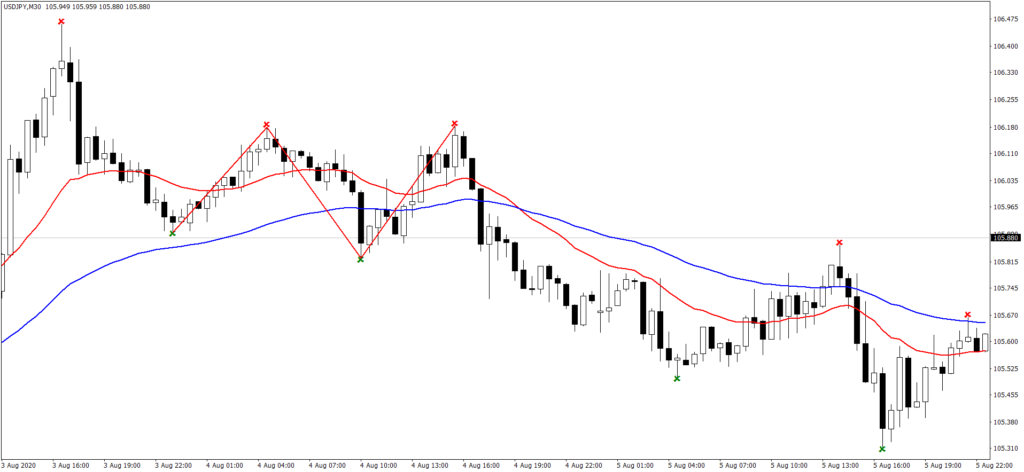
Does it look like AB=CD? Definitely it does. But there is a caveat. C point is below A which disqualifies it as an AB=CD chart pattern. We are about to miss a good move on USDJPY with a small stop loss. But if we had used the Symmetry Chart Pattern which I have explained above, we only compare the alternate price projections. Both swing have almost equal bars. First one has 13 bars and the second one has 12 bars. So it qualifies as a symmetry pattern but it does not qualify as an AB=CD chart pattern. If we open a trade with this symmetry patter, we have a stop loss less than 10 pips and we could have easily made 50 pips with an excellent Reward/Risk of 5:1. Both the Fibonacci Price And Fibonacci Time were in confluence giving us a good Symmetry Chart Pattern. Coding Symmetry Chart Pattern is far easier as compared to coding the AB=CD and the Gartley Pattern. Take a look at the following USDJPY H1 chart.
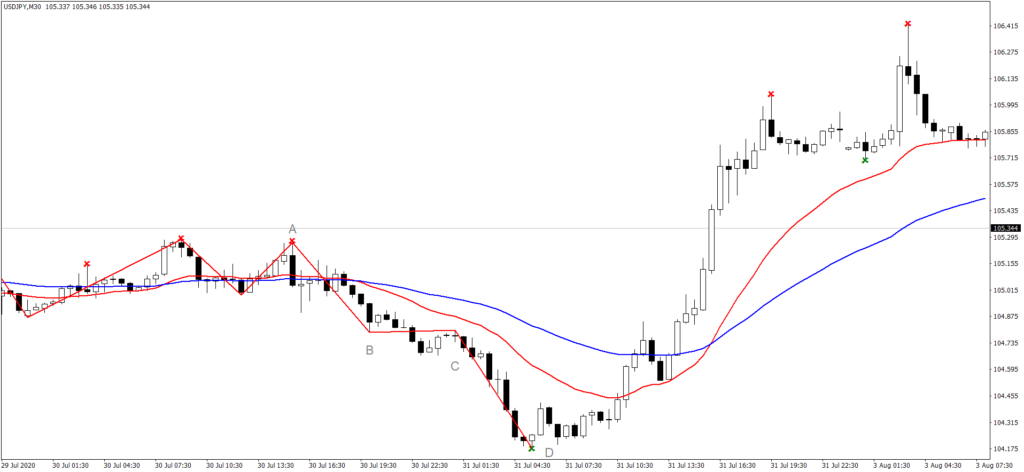
I have labeled the above USDJPY H1 chart ABCD. If you strictly follow the AB=CD pattern specifications, you cannot label the above chart formation as AB=CD. But if we use the symmetry pattern than we have a perfect symmetry pattern. As you can see just after D, USDJPY made a rally of around 150 pips. As you can see the harmonic chart patterns have very strict specifications. If we try to follow the exact ratios, we will miss most of the time the good moves in the market. Symmetry pattern is just the Fibonacci projection pattern. The ideal symmetry pattern is when we project price with 1:1 ratio.
As far as Fibonacci Time Analysis is concerned, I have found it to be more theory and less practice. Maybe I am wrong. But Fibonacci Time Analysis is not as accurate as Fibonacci Price Analysis. Harmonic Chart Pattern analysis is more of an art than a science. It all depends on you choose your swings which makes it more of an art than science. In trading we should respect the KISS principle. We should keep things as simple as possible. As I have demonstrated above Symmetry Pattern works and most of the time it is not subjective. When we have a symmetry pattern we need to look for at least two more things for confluence. The idea is to find a 5 Star Trade. We should avoid over trading at all costs. Over trading is the killer of your trading account and ultimately it will drain your confidence level as well.